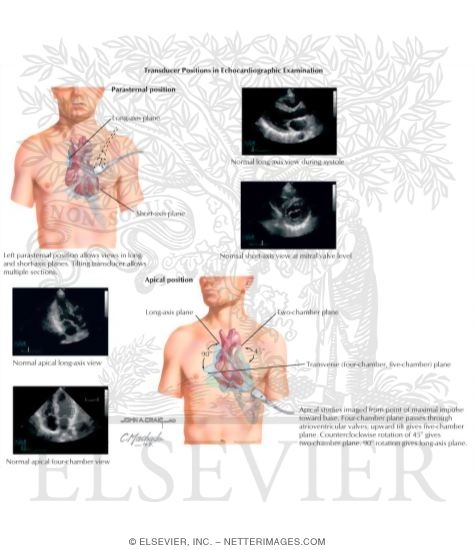
Echocardiography
Image ID: 21400
 Pricing
Hi-Resolution
14.3 MB EPS
Good For All Uses:
Print, Electronic and Digital
Please Note: Specialized programs, such as Adobe Illustrator, are needed to use EPS files.
Lo-Resolution
906x1066 px
163.1 KB
RGB JPG
Best For:
Electronic and digital use: (e.g. websites, PowerPoint, broadcast, VHS, CD/DVD)
 Images on Similar Topics
Check all topics of interest and press 'display'
or click on an individual term:

 
Netter ad clinical key
Echocardiography
Force–velocity curves depict the effect of afterload on velocity of contraction of cardiac muscle. A, When the force of contraction is higher (i.e., when the muscle contracts against higher afterload), velocity of shortening is reduced. Velocity is highest (Vm) at zero afterload. Increased preload shifts the curve upward, but Vm, a measure of contractility, is unchanged. B, Positive inotropic influences such as sympathetic stimulation change Vm. The force–velocity curve is shifted upward.

The preview images do not contain enough pixels to make small type legible on screen, however,
the actual delivered images will contain labels that are clearly legible. (view PDF preview)
  Other Versions of This Illustration
Unlabeled image
  This Illustration was Published In
Netter's Essential Physiology
Author: Susan E. Mulroney, Adam K. Myers
Chapter: The Cardiac Pump
Page: 120
 
If you can see this message, you need to update your Flash Player.
poster ad Elsevier

    TERMS OF USE    PRIVACY POLICY    HELP    CONTACT US     ABOUT US

BOOKMARK THIS PAGE: Digg It!  Add to del.icio.us  Add to StumbleUpon  Add to Reddit  Add to Technorati  Add to Furl  Add to Netscape