
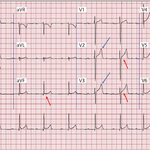
ECG demonstrating early repolarization (J-point and ST-segment elevation) in II, aVF, and V4-V6 (red arrows) and tall, peaked T waves (blue arrows)
ID: 78657
Category: Unlabeled
Please describe! how you will use this image and then you will be able to add this image to your shopping basket.


 Please Wait...